[home] [weblog] [science] [people] [station] [ny-ålesund] [sightings] [sitemap] [nederlands]
| [previous] |
science |
|
[home] [weblog] [science] [people] [station] [ny-ålesund] [sightings] [sitemap] [nederlands] |
|
Climate change | 1 September 2018 |
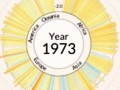
| How has temperature changed in each country over the last century? This data visualisation shows temperature anomaly – the departure from the long-term average from 1900-2016. Visualisation by Antti Lipponen (@anttilip) of the Finnish Meteorological Institute | |
| Another impressive way to show the change in average temperature is this video, where data are lumped per country from 1880 to 2017 | |
| What should we do? This video might motivate us. | |
[home] [weblog] [science] [people] [station] [ny-ålesund] [sightings] [sitemap] [nederlands]

|
|||||||
| [previous] | [present] | [overview] | |||||
 |
 |
||||||
| , | 20180901, 13:40 | all items shown with small pics | |||||
| climate change |